
Spectrum of a sampled signal
The most common use of a Fourier transform: which frequencies are in a measured signal, and how strong are they? Here a signal of 1 s sampled at 8192 Hz contains two tones and some noise. The record is exactly one second long, so each frequency bin is 1 Hz wide and the tones fall on bins without leakage.
using FFTL, CairoMakie, Random
Random.seed!(2)

fs = 8192.0                        # sampling rate in Hz
N = 8192                           # samples: 1 s
t = (0:N-1) ./ fs
x = 0.8 .* sin.(2π * 440 .* t) .+ 0.3 .* sin.(2π * 1234 .* t) .+ 0.05 .* randn(N);
A real signal has a spectrum with Hermitian symmetry, so rfft returns only the bins from 0 Hz up to the Nyquist frequency
X = rfft(x);
size(X)(4097,)Amplitudes
For a sinusoid of amplitude
f = (0:N÷2) .* (fs / N);
amp = 2 .* abs.(X) ./ N;
Pick the strongest bins above a threshold and report them:
idx = findall(>(0.1), amp);
for k in idx
  println("f = ", round(f[k]; digits = 1), " Hz, amplitude ", round(amp[k]; digits = 3))
end
f = 440.0 Hz, amplitude 0.799
f = 1234.0 Hz, amplitude 0.3The two tones come out at 440 Hz and 1234 Hz with amplitudes close to 0.8 and 0.3; the noise stays well below the threshold.
The spectrum itself, with the bins above the threshold and the threshold line:
fig = Figure(size = (640, 380))
ax = Axis(fig[1, 1]; xlabel = "Frequency (Hz)", ylabel = "Amplitude",
          limits = (0, fs / 2, 0, 1))
lines!(ax, f, amp)
scatter!(ax, f[idx], amp[idx])
hlines!(ax, 0.1; color = :gray, linestyle = :dash)
text!(ax, f[idx], amp[idx] .+ 0.06;
      text = [string(Int(round(fk)), " Hz") for fk in f[idx]],
      align = (:center, :bottom))
fig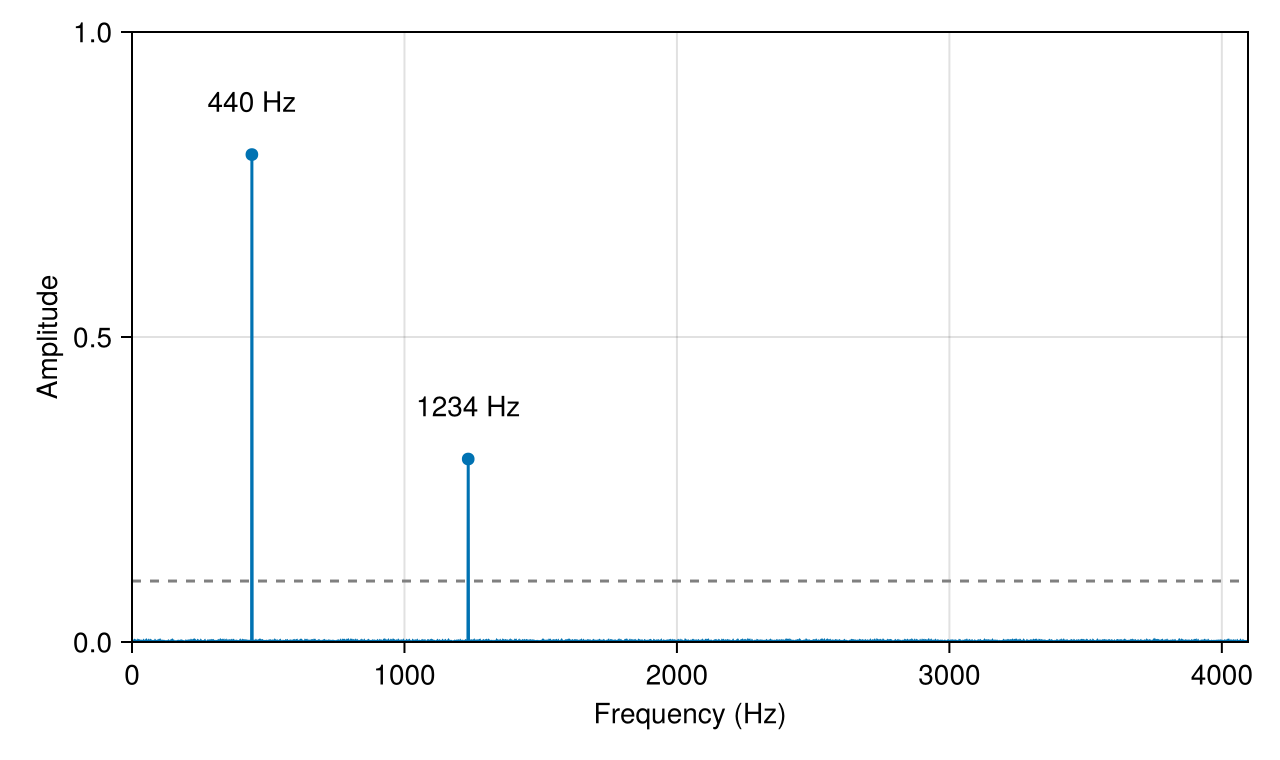
Long recordings
The transform of the whole record is one call. For a long recording, a plan for the block length is made once and applied to every block (see Plans and reuse).
Inverse
Applying the inverse real transform to the spectrum with the two tones removed gives the noise alone:
Y = copy(X);
Y[idx] .= 0;
clean = irfft(Y, N);
round(sqrt(sum(abs2, clean) / N); digits = 3) # RMS, the noise was 0.050.05This page was generated using Literate.jl.